Share this article
It’s nice to talk about fundraising in the abstract and offer up best practices and tips for making the most of your fundraising techniques and tactics. However, sometimes it helps to have some numbers and figures thrown in to show the results of all the tips. The best way to make an effective fundraising strategy for your nonprofit is to utilize data to give you a way to predict how a campaign will go.

Having said that, let’s take a look at some fundraising statistics that you should know for 2025:
- General fundraising statistics
- Demographics statistics
- Year-end giving statistics
- Online donation statistics
- Social media fundraising statistics
- Mobile fundraising statistics
- Email fundraising statistics
- Fundraising event statistics
- Peer-to-peer statistics
- Volunteering statistics
- Grant statistics
- Corporate philanthropy statistics
- Recurring giving statistics
- Matching gifts statistics
- Major gift statistics
- Tech statistics
- Sources
General fundraising statistics
- There are over 1.5 million nonprofit organizations in the United States.
- For one-time gifts, the average donation amount is $121.
- The average donation amount for a recurring gift is $25.
- 46.48% of nonprofit staff find rising operating expenses the biggest challenge for nonprofits.
- There are almost 1 million smaller organizations in the United States that make below $50,000 in annual revenue.
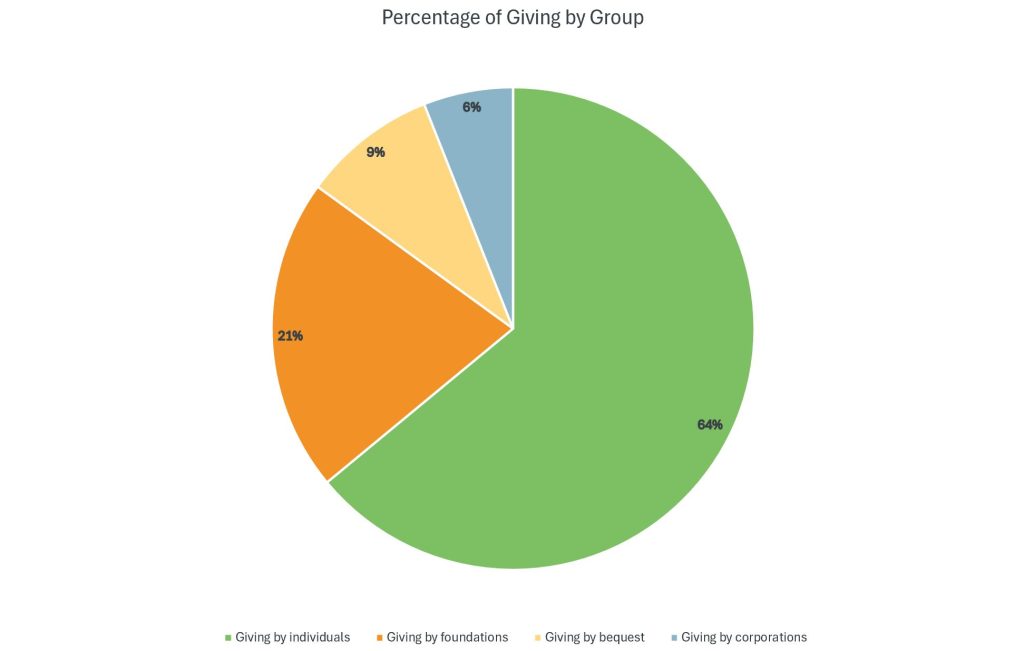
- $319.04 billion dollars was donated by individuals in 2022.
- 6.5 billion dollars were raised in 2023.
- There were around 4.8 million donors in 2023.
- Giving decreased 2.8% in 2023.
While giving decreased in 2023, there are things that your organization can do to overcome some of these struggles! One way to help overcome the decrease in giving is to send personalized acknowledgements to first-time donors. Our Sustainable Giving Report found over 80% of donors are more likely to give again if reached out to.
Your fundraising software can also help you beat the decrease in giving! The average one-time gift on Bloomerang Fundraising’s platform was 37% higher than the industry average, and the average recurring gift was 58% higher.
Demographics statistics
- 75% of Gen Z has donated to a nonprofit in the past year.
- Over 90% of Millennials, Gen X, Baby Boomers, and the Silent Generation have given in the past year.
- Over 50% of Gen Z is willing to fundraise for your organization.
- 63% of Millennials research an organization before providing support.
- 11% of Gen X serves on a nonprofit committee or board.
- On average, baby boomers donate between $100 to $499 per year.
- 84% of women said charitable giving was important to their lives in 2021.
- 20% of men talk to a financial advisor about charitable planning.
It’s important to think about the audience you want to appeal to when fundraising! Each generation has different trends in how they engage with the nonprofit world, and there may be better strategies to help you better reach your target demographic. Stay flexible in your fundraising approaches and tailor your strategy to meet your donors where they are.
Year-end giving statistics
- In 2022, giving on December 31st decreased 13% compared to 2021.
- Giving Tuesday accounted for 3% of all online fundraising in 2022.
- 20% of giving occurs in December.
- December 31st accounted for 5% of total revenue for nonprofits in 2022.
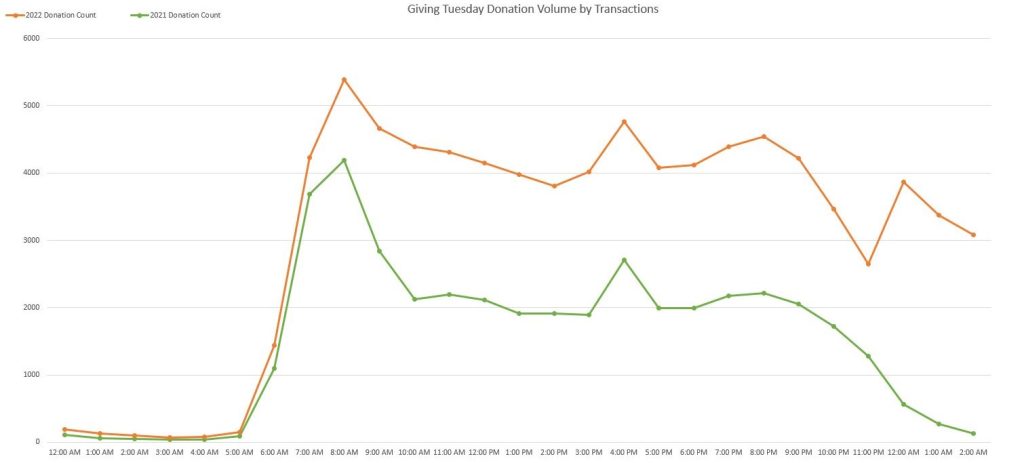
- The largest number of donations made on Bloomerang Fundraising donation pages on Giving Tuesday 2022 occurred between 10 a.m. and 1 p.m. ET.
- On December 31, 2022, the largest number of donations made on Bloomerang Fundraising forms occurred between 7:00 a.m. and 10:00 a.m. ET.
- The average gift size on December 31, 2022, is nearly $100 greater than Giving Tuesday 2022, according to the Bloomerang Fundraising platform.
Year-end giving isn’t safe from the decline in giving either, but it’s still one of the best times of the year to raise money for your cause. Keep the donors you recruit at the end of the year by optimizing your donation forms and providing multiple options to give.
Online donation statistics
- Online giving declined by 4% from 2021 to 2022.
- The retention rate for online one-time donors is 29%.
- According to the Bloomerang Fundraising platform, nonprofits who use abandoned gift reminders on their donation forms turn 5% more of their donation form’s visitors into donors on average.
- Nonprofits using Bloomerang Fundraising’s Express Donate see up to a 55% increase in donation conversion rates.
- Online giving made up 26% of donations in 2023.
- Around $0.11 of every dollar donated online was reinvested into digital advertising.
While online donations have dropped, it’s still a large part of the fundraising world. The best way to get your supporters to complete a donation online is to make it as fast and as easy to give as possible.
Social media fundraising statistics
- Facebook Fundraisers accrue an average of 4 gifts.
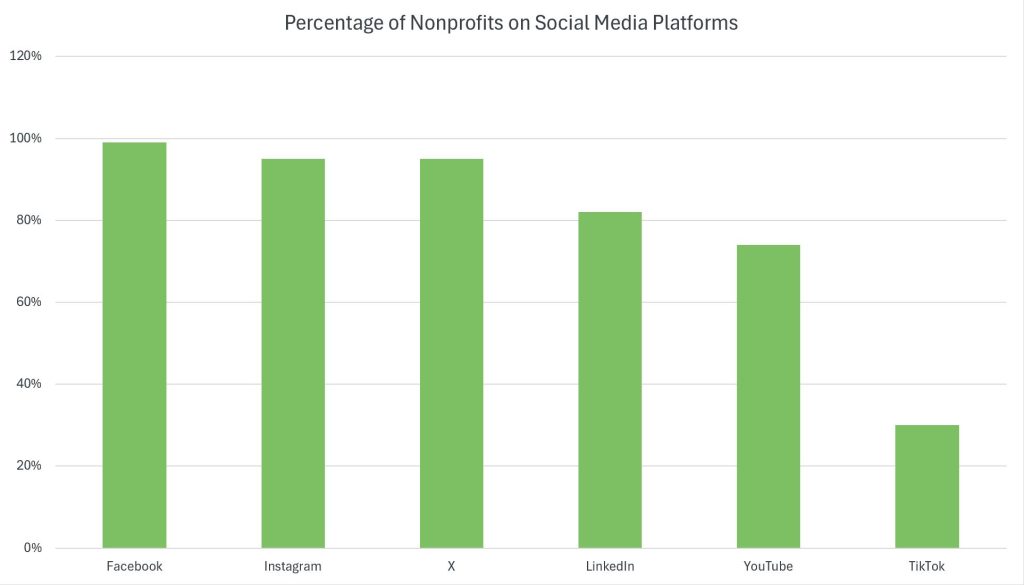
- 30% of nonprofits were active on TikTok in 2022.
- 95% of nonprofits were active on Instagram and X.
- Facebook earned nonprofits 1.1% of total revenue in 2022.
- Instagram posts reach over 50 more people per a thousand followers than Facebook posts.
- 73% of Millennials prefer to stay in touch with nonprofits through social media.
- There’s over 308 million social media users in the United States.
Social media is one of the biggest tools in a nonprofit’s toolbelt. Social media offers you a free way to connect with your donors on a more personal level, as well as market your upcoming campaigns. With millions of users across the different platforms, you can inspire your donors wherever they are.
Mobile fundraising statistics
- There was an 11% increase to mobile fundraising subscriber lists in 2022.
- Nonprofits increased the amount of mobile messages sent in 2022 by 28%.
- Mobile users made up 57% of nonprofit website traffic.
- 36% of mobile website visitors completed a donation.
- Nonprofits using Bloomerang Fundraising’s text-to-donate see a 58% gift completion rate from donations initiated by text message.
- As of 2023, there are over 310 million smartphone users in the United States.
It’s no secret that people are constantly on their phones–which makes it the perfect way to reach your donors. More supporters are signing up to receive texts from organizations like yours, giving you another way to engage with your donor base.
Email fundraising statistics
- Like online donations, revenue from email campaigns declined by 4% in 2022.
- Email open rates increase 329% when nonprofits personalize the sender.
- Adding a donor’s name to an email increases the open rate by 270%.
- Welcome series that focus on offering content can increase donor conversion rate by 920%.
- Email accrued 14% of total online revenue for nonprofits in 2022.
- On average, email subscriber lists saw a 2% decrease in 2022.
- In 2022, nonprofits sent an average of 60 emails per subscriber.
Email is another great personalized way for your organization to engage with your donors. After all, 18% of donors stop giving because of poor service or communication. When using Bloomerang’s donor management tools, you can actually keep track of your donor’s engagement meter to ensure you stay connected.
Fundraising event statistics
- 27% of our Sustainable Giving Report hosts five or more fundraising events per year.
- 33% of donors prefer in-person fundraising events.
- 44% of organizations include some hybrid or virtual fundraising events.
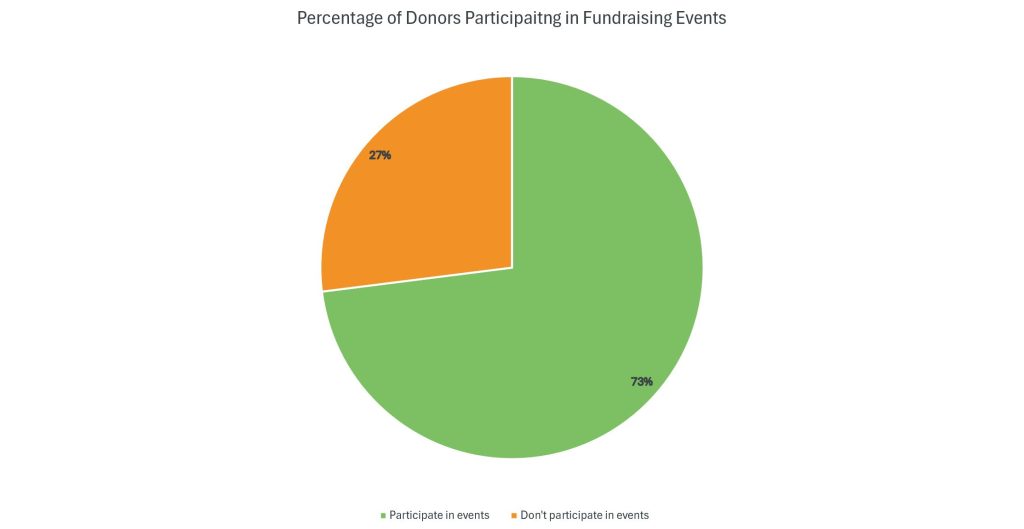
- Around 27% of donors don’t participate in fundraising events.
- The clickthrough rate for email event invites is 1.3%.
Fundraising events help you connect with your donors both in person and online. Using Bloomerang’s event management tools, you can embed your event registration button directly onto your website so your donors never have to leave your page to keep the registration process as simple as possible.
Peer-to-peer statistics
- Around 39% of Americans have donated to a cause because of a request made by a friend or family member.
- 62% of peer-to-peer text messaging includes a fundraising appeal.
- The average amount raised by peer-to-peer fundraisers is $244.
- Over 50% of Gen X and Gen Z are willing to fundraise on behalf of nonprofits.
- Only 27% of the Silent Generation are willing to fundraise for an organization.
- In 2021, 44 organizations hosting digital peer-to-peer fundraising raised over $154 million.
Even with giving decreases, peer-to-peer fundraising remains one of the best ways to recruit new donors. Bloomerang’s peer-to-peer software can help your fundraiser make their own personal fundraising pages to raise funds for your nonprofit.
Volunteering statistics
- In 2023, an hour of volunteer work was worth over $30.
- Around 85% of volunteers also donate to the same organization.
- In 2021, Utah had the highest percentage of volunteers.
- Over 50% of Gen X and Gen Z volunteer time to nonprofits.
- 33% of volunteer managers identify recruitment as the hardest roadblock for volunteering.
- As of 2022, most volunteers average 10-20 hours per month.
Volunteer hours are worth more now than ever, yet volunteer managers say the biggest roadblock they have for finding volunteers is recruitment. Using Bloomerang’s volunteer management services, you can sign up, track, and schedule your volunteers from one place to make volunteering easier for both your staff and your volunteers.
Grant statistics
- 1 in 10 grant proposals are successful.
- Nonprofits using Google Grants saw 431 site views per $1K of the grant used.
- Google Grant has a $0.07 return on ad spend.
- Federal grant proposals can take over 100 hours to complete.
- 3% of grant funding comes from corporations.
- 92% of grantmaking entities are foundations.
With giving in a decline, it’s important to look at other income revenues your nonprofit can use to create positive change in the world. While grant proposal writing can be difficult, grant funding can help skyrocket one of your organization’s programs into success to help you create a sustainable change.
Corporate philanthropy statistics
- 6% of giving is accrued from corporate giving.
- Around 70% of Americans value corporate social responsibility (CSR).
- 55% of American consumers prefer companies to take a stance on social issues.
- Over 70% of investors consider CSR in their investment decisions.
- About 60% of employees are willing to be paid less to work at a company with a strong purpose.
- 99% of CSR professionals had CSR efforts impacted by COVID-19.
People are expecting companies to take on social responsibilities more and more over the years. As corporations look to connect with their communities, your organization can form partnerships to help them while also boosting your fundraising. Reach out to companies with similar missions to create a matching gift program, a volunteer program, or a cause marketing campaign.
Recurring giving statistics
- The average amount given monthly is around $25.
- 32% of Millennials give recurring monthly gifts to nonprofits.
- 25% of Gen X donors schedule recurring gifts.
- In 2022, monthly giving revenue increased by 11%.
- Monthly giving made up 28% of all online giving.
- On average, recurring donors gave $287 in 2022.
Recurring giving helps you keep donors engaged and active in your organization. By allowing donors to automatically give on a schedule, you make it easier for them to continue to support your mission.
Matching gifts statistics
- Around 65% of Fortune 500 companies provide a matching gift program to employees.
- Gen X has the highest percentage of donations matched by an employer at 26%
- 84% of workers are more likely to donate if the gift is matched.
- Over 90% of companies offering gift matching offer a 1:1 match.
- Billions of potential matching gifts go unclaimed throughout the year.
- $50 is usually the maximum gift match amount for over 90% of companies.
Gift matching can effectively double the amount of funds your nonprofit receives per donation. With so much money lost in eligible gift matching programs, it’s important to ensure your donors know their options. Use Blooemerang Fundraising’s donation forms to embed a matching gift search straight onto your form, removing the guesswork from your donors.
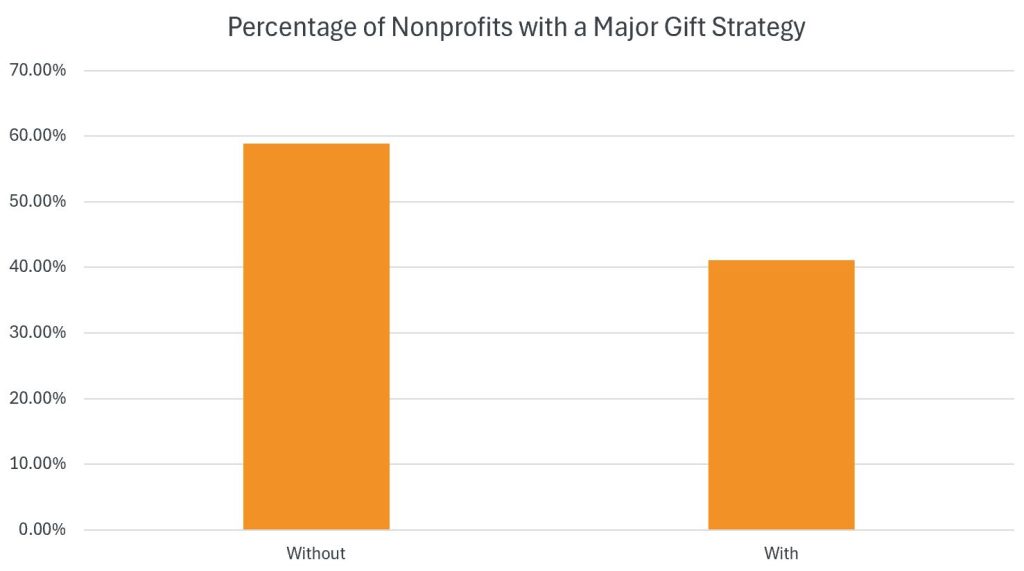
Major gift statistics
- 12% of donors give 88% of funds.
- Less than 60% of nonprofits have a major gift strategy.
- The number of major donors was down 6.8% in 2023.
- 65.8% of major donors were retained.
- In 2021, 49% of donor-advised funds (DAF) had less than $50,000 in assets.
- The average payout of a DAF was 18%.
- Less than 6% of Americans make charitable bequests in their wills.
Major gifts often make up the majority of the funds your nonprofit sees throughout the year, but with retention of major donors down, it’s best to have a major gift strategy in place to steward your donors once the entire their giving journey at your organization. 13% of donors stop giving due to lack of acknowledgement.
Tech statistics
- 67% of marketers believe adoption of AI is essential for acquisition and retention.
- Over 70% of marketers said AI insights on campaign performance would be valuable.
- Website user experience can help increase conversion rates by up to 400%.
- Around 67% of organizations take advantage of a CRM for donor communication management.
- Over 90% of nonprofits have mobile-optimized websites.
- Only 70% of organizations use a fundraising solution that offers automated donation receipts.
Technology is constantly evolving and that can be a great help to your nonprofit, but it can be hard to keep up. With the right fundraising tools, you can beat the giving decline and increase your fundraising. Bloomerang can help you streamline your daily tasks with different fundraising automation tools.
Sources
- Statista
- M&R Benchmarks
- Generational Giving Report
- 2021 Women and Giving
- FEP 2023 Quarterly Benchmark Report
- Key End-of-Year Giving Trends: Giving Tuesday vs. December 31
- GivingPulse
- Overall Giving Trends
- Giving USA
- Digital Fundraising Research Library
- Sustainable Giving Report
- How to Build a Major Gifts Pipeline Using Peer-to-Peer Fundraising
- 2022 Digital-First Peer-to-Peer Study
- Value of Volunteer Time Report
- 20 Volunteer Statistics Every Nonprofit Should Know
- Volunteer Management Progress Report
- 15 Eye-Opening Corporate Social Responsibility Statistics
- 35 Grant Statistics for 2024: The Ultimate List
- 15+ Powerful CSR Statistics About The Impact of Giving Back
- Major Gift Fundraising By The Numbers
- Philanthropy’s Missing Trillions
- DAFRC Report
- Intuit Mailchimp Finds Vast Majority of SMB Marketers Are Bought Into Artificial Intelligence
- 7 Website Statistics to Guide Your Next Refresh or Upgrade
- 2023 Nonprofit Tech for Good Report
- 2025 Online Fundraising Statistics for Nonprofits
Final thoughts
Keeping up to date with the latest fundraising research is a great way for your nonprofit to stay ahead and achieve your mission. Combine these fundraising statistics with your donor data to create customized strategy for your organization. Check out our different eBooks in the Resource Center for more data as well as helpful tips!
You might enjoy

Peer-to-Peer Fundraising: FAQs and Steps to Launch Campaigns
Fundraising by type


7 donation request email examples + tips to increase revenue
Fundraising ideas