Share this article
You and I both know that some parts of working in a nonprofit can’t be measured. You can’t put a number on the feeling of feeding families. Measuring the joy of helping your community is impossible. Making a difference in the world isn’t something you can count. But there are some fundraising statistics you should keep an eye on. Tracking these 8 fundraising statistics will help you measure the effectiveness of your campaigns, better retain donors, and more. We’ll show you what they are, why they matter, and how to put them to work.
And hey! If you’re a Qgiv client using our Data package, these fundraising statistics are available to you in your organization-level dashboard. If you’ve used Qgiv for at least a year (we need a full 12 months of data to give you insights like donor retention, churn, etc.), you have access to these stats right now! If you have any questions, send us an email or call us at 888-855-9595. If you’re not a Qgiv client, this information is still applicable to your fundraising. You can always contact us to learn more about our tools, too!
Let’s take a look at the stats!
8 Important Fundraising Statistics You Should Track
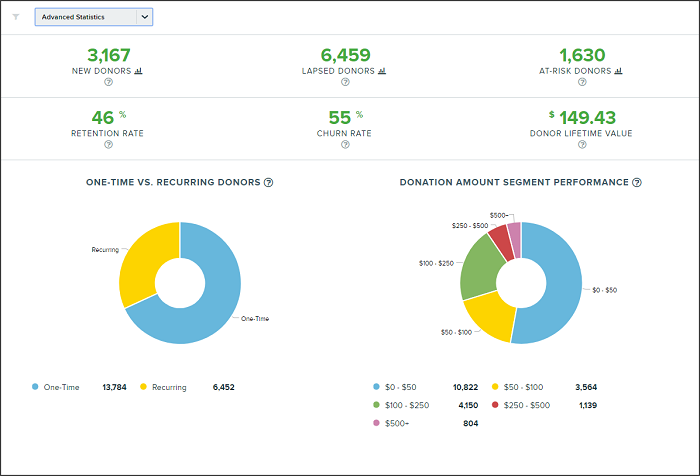
1. Number of New Donors
Let’s start with an easy one: your number of new donors. At Qgiv, “new donors” are donors who have given their first gift within the last three months.
Measuring the number of new donors you recruit during a campaign gives you insight into how successful your communications are.
One of the best ways to use this statistic to improve your fundraising is by measuring the influx of new donors month over month. It also gives you the opportunity to start a new-donor welcome series! Identifying new donors, welcoming them to your community, and sharing how their gift will make a difference is an important first step to building good donor retention (more on that later).
You can also get a good feel for how people interact with your organization throughout different seasons or cycles. But the number of new donors is most useful when comparing it to other statistics, like…
2. Number of Lapsed Donors
Lapsed donors are donors who have given to you before but have not made a gift in the last year. If you’ve got lots of lapsed donors, that’s not unusual! Most donors actually never give more than once. But lapsed donors represent an opportunity to rekindle some once fruitful relationships. Every name on your lapsed donor list represents someone who was once inspired to donate to your cause. You can inspire them again!
Use this statistic to keep an eye on your lapsed donors’ patterns. If you notice your list of lapsed donors increasing dramatically, it’s time to revisit your donor retention methods. You can also pull a report of your lapsed donors and start a campaign to re-engage them.
3. Number of At-Risk Donors
This is an interesting statistic! At-risk donors are people who have donated to you in the past but haven’t donated to you within the past 9 months. If they don’t make a donation over the next few months, they’ll move into your “lapsed donor” pool.
Use this statistic as a way to gauge your donor retention methods. You want to see this number get smaller! This is also an ideal way to identify donors who should receive targeted emails aimed at re-engaging them.
4. Donor Retention Rate
This is one of our favorite topics! If you’ve read the Qgiv blog with any regularity, you’ve probably seen us talk about donor retention and why it’s so important. But how do you actually measure your donor retention rate?
It’s easy! Your donor retention rate is the percentage of donors who continue to donate to your nonprofit year after year. To find your donor retention rate, use this formula (or just look at your “Advanced Statistics” view in your Qgiv dashboard):
- Find the number of people who donated to your organization in one 12-month span (year-one donors).
- Then, identify the donors in that first pool who gave again the second year (donors who gave again in year 2).
- Divide the number from year 1 by the number from year 2.
- Voila! That’s your donor retention rate.
We won’t go super into detail about what you can do to retain your donors in this article (but you can check out great donor retention resources like this one, this one, or this one). But knowing that statistic is important! In 2017, the average nonprofit’s donor retention rate was 45%. That means that of every 100 new donors a nonprofit recruited, 55 never made another gift. Knowing your donor retention rate will help you gauge how you’re doing compared to other nonprofits and identify ways you can keep your donors engaged year after year.
5. Churn Rate
This is exactly the opposite of your donor retention rate. Churn measures donors who gave in one 12-month period but never made a gift in the following year. If your churn rate is higher than the industry average of 55%, it’s time to explore why!
The upside of having a high churn rate is that you have tons of opportunities to put better donor retention methods in to practice. Here’s a great place to start getting ideas!
6. Donor Lifetime Value
If you take the average that donors give each year and adjust it for the churn rate, you get your donor lifetime value. It’s the average dollar value associated with each donor! Now, that doesn’t mean that each donor gives that amount. It’s just an average.
But it’s still a useful statistic to know! It’s especially useful if you track the cost of acquiring donors. If you spend $450 to acquire a new donor, and their lifetime value is $600, you’re doing pretty well! But if their lifetime value is $372, it’s time to take a hard look at your marketing and fundraising methods. This statistic is all about efficiency!
7. One-Time vs. Recurring Donors
Recurring donors—commonly called sustaining donors—are every nonprofit’s best friend. They represent reliable revenue that you can depend upon month after month! Most nonprofits will have a higher ratio of one-time donors than recurring donors—and that’s okay!
This statistic is useful for measuring your recurring program’s success. If the ratio of recurring donors to one-time donors gets bigger, you’re doing a great job of recruiting and retaining sustaining donors. If it starts to drop, it’s time to step up your donor retention and recruitment methods!
8. Donation Amount Segment Performance
This stat separates your donations in to segments based on the size of each gift. At Qgiv, we measure 5 segments: $0-$49, $50-$99, $100-$249, $250-$499, and $500+.
Keeping an eye on this statistic gives you insight into how much your donors are able to give. That insight is valuable because it can help you adjust your asks, set good suggested donation amounts on your forms, and more. If the vast majority of your donors are giving in the $50-$100 range, for example, you probably don’t want to send a huge appeal asking for a $500 donation.
Conclusion:
Tracking fundraising statistics around new, lapsed, and at-risk donors, retention vs. churn rates, and patterns in gift size and occurrence is important! Those stats will help you write better appeals, target donors more effectively, and hone your fundraising methods for maximum efficiency. If you’ve used Qgiv for at least a year and are using our Data Package, these advanced stats are at your fingertips! You can easily access them on your organization’s dashboard, and they’re available for download in your reports.
Are you a Qgiv client who’s interested in these advanced stats? Contact us at 888-855-9595 or support@qgiv.com to learn more about our Data Package and how to make the most of all its tools. If you’re not a Qgiv user but are interested in learning more about all the tracking and reporting tools we have to offer, contact us for a demo! We’ll give you a one-on-one tour of our tools, learn about your needs, and work with you to find a solution you’ll love.
You might enjoy

Peer-to-Peer Fundraising: FAQs and Steps to Launch Campaigns
Fundraising by type


7 donation request email examples + tips to increase revenue
Fundraising ideas